New web performance metrics added to Event Genius’ reporting tools
Written by Kevin Lawson, 5th December 2018
We’re delighted to announce the details of a small but significant upgrade to the insights and data we provide to clients using the Event Genius platform.
Launching today, the upgrade was developed in response to the changes you asked for as part of our client survey earlier in 2018 and provides all clients with visibility of the following new web performance metrics for their box offices or Ticket Arena event listings:
- Total Visits
- Unique Visits
- # of Orders
- Conversion Rate
- Average Tickets Per Order
- Average Face Value
The new data provides clients with a more detailed understanding of exactly how their events are performing online and are displayed in summary tables that can be accessed in two areas of the platform:
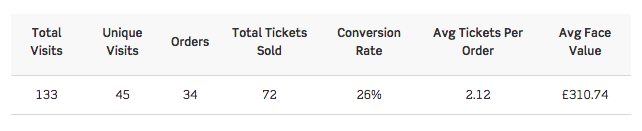
Company dashboard
Providing a summary from data across all events linked to your company, this dashboard shows data collected in the last 30 days.
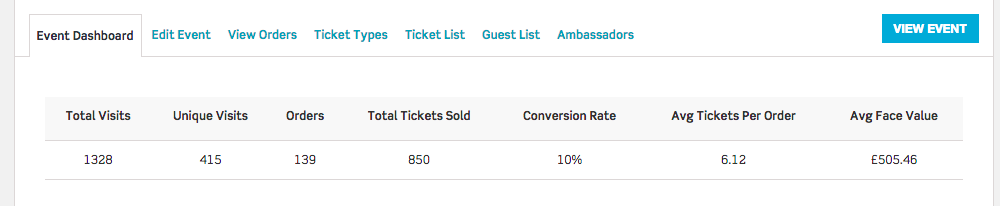
Event dashboard
A summary of the same performance statistics for the lifetime of a single event within a company.
To make sure you keep up to date with all the developments and updates at Event Genius, please subscribe to our newsletter by entering your email below:
Related content - Ticket Arena & Event Genius launch new checkout with Apple Pay & Google Pay
Categories
- All Blogs
- Best Practice (5)
- Company News (64)
- Current Openings (4)
- Event Genius Services (32)
- Event Industry News (29)
- In Depth (7)
- New Features (28)
- Training (1)